

A few years ago, I found myself at a trivia night. The final round asked for the average net worth of everyone in the room, and one quick-thinking teammate shouted: "If Bill Gates walks in, the average goes from $500 to $1 billion!" We laughed, but later I realized that this isn't just a weird quirk—in real life, a single outlier can redefine the whole story. Welcome to the strange universe of power law distributions, where averages routinely lie and the rarest events wield outsized influence. Before you place your next bet, buy a lottery ticket, or even launch a startup, you need to understand why power laws flip 'normal' on its head.
Normal Isn’t Always Normal: When Bell Curves Fail Us
When you look around at the world, you might expect most things to follow a predictable pattern. For many natural traits—like human height, IQ, or the size of apples on a tree—this is true. Most people are about average height, and the number of people who are much taller or shorter drops off quickly. This pattern is called the normal distribution, and it’s often shown as a bell-shaped curve. But as you’ll see, the bell curve doesn’t always tell the whole story.
The Bell Curve: Symmetry and Predictability
The normal distribution, or bell curve, is famous for its symmetry. Most values cluster tightly around the average, and the chances of seeing something far from the average are extremely low. This idea goes back to the 1700s, when Abraham de Moivre first explored probability and found that random, additive effects—like genetics plus nutrition determining height—naturally create this shape. If you toss a coin 100 times and win $1 for every heads, you’ll probably end up close to $50. The average and standard deviation (a measure of spread) work perfectly here, because the data is balanced and predictable.
| Scenario | Expected Outcome | Explanation |
|---|---|---|
| Coin Toss Game (100 tosses, $1 per win) | $50 average payout | Most people will win close to 50 times; extreme results are rare. |
| Human Height | About 5'7" (average adult male height) | Almost nobody is twice or five times the average height. |
As one expert put it:
"You're never going to find someone who is say five times the average height. That would be physically impossible."
Why Additive Effects Create Bell Curves
Normal distributions arise when many small, independent factors add up. For example, your height is the result of your genes, your nutrition, and other minor influences. Each factor nudges you a little up or down, but together, they keep most people close to the average. Outliers—people who are extremely tall or short—are very rare. The bell curve’s “thin tails” mean that extreme values are almost impossible.
- Symmetric: The curve is the same on both sides of the average.
- Strong Central Tendency: Most data points are near the mean.
- Thin Tails: Outliers are extremely rare.
When the Bell Curve Fails: Real-World Surprises
Here’s the catch: not everything in life follows a normal distribution. We often expect the world to fit the bell curve, but many real-world events—like natural disasters, financial crashes, or even the size of wars—don’t. These situations are governed by power law distributions, which have “fat tails.” In these cases, extreme events are far more common than the bell curve predicts, and averages can be misleading.
Most of our everyday assumptions—about risk, fairness, and what’s possible—are grounded in the normal distribution. But when reality doesn’t match this model, it can lead to catastrophic misunderstandings. Recognizing when you’re dealing with a bell curve (and when you’re not) is crucial for making sense of the world’s hidden extremes.
Pareto’s Big Discovery: Mapping Income’s Heavy Tail
When you think about how income is spread out in a country, you might expect it to look like a bell curve—a normal distribution, just like height or IQ. Most people would cluster around the average, and only a few would be much richer or poorer. But in the late 1800s, Italian engineer Vilfredo Pareto discovered something that turned this idea on its head. His analysis of income data across Italy, England, France, and Prussia revealed a pattern that was not a bell curve at all. Instead, he found what we now call the Pareto income distribution—a type of power law that explains why a small number of people control a large share of wealth.
From Bell Curves to Power Laws: The Shape of Income Distribution
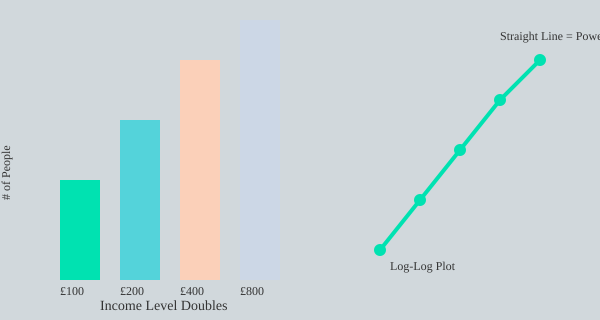
Pareto’s approach was simple yet revolutionary. He gathered income tax records from several European countries and plotted the number of people earning more than a certain amount. What he found was striking: the curve dropped off quickly at first, but then it flattened out, stretching across several orders of magnitude. In other words, there were always a few people earning five, ten, or even a hundred times more than the average. This kind of spread would be impossible if income followed a normal distribution, where extreme outliers are vanishingly rare. But with the Pareto distribution, these extremes are not just possible—they’re expected.
The Power of Log-Log Plots: Revealing the Hidden Pattern
To make sense of this huge range of incomes, Pareto used a clever trick: he plotted the data on a log-log plot. Instead of a curvy, complicated shape, the data transformed into a straight line. This straight line is the signature of a power law, and it’s a key diagnostic tool for spotting these distributions. For England, the gradient of this line was about -1.5. That means every time income doubles—say, from 200 to 400 pounds—the number of people earning at least that much drops by a factor of about 2.8. This pattern repeats at every level of income, no matter how high you go.
"Pareto could describe the distribution of incomes with one simple equation: the number of people who earn an income greater than or equal to X is proportional to 1 over X to the power of 1.5."
Pareto’s Equation and the 80/20 Rule
The formula Pareto found is simple but powerful: Number earning ≥ X ∝ 1/X1.5. This relationship, known as the Pareto distribution, has been observed in income data from all over the world. It’s also the math behind the famous 80/20 rule (or Pareto principle): about 80% of wealth is held by 20% of people. This isn’t just a quirk of one country or era—it’s a universal feature of how income is distributed.
- Income distribution is not a bell curve—it’s a heavy-tailed power law.
- Log-log plots reveal straight lines, exposing the underlying power law.
- The Pareto income distribution equation holds across nations and time periods.
- The 80/20 rule is a natural result of this distribution.
Visualizing Pareto’s Discovery
Pareto’s cross-national studies showed that the Pareto income distribution is not just a statistical oddity. It’s a fundamental law of how wealth and income are spread in society. The heavy tail of the distribution means that extreme wealth—and extreme poverty—are not rare accidents, but built into the very structure of our economies.
Chance Games and Infinite Averages: Three Coin Tosses to Rule Them All
Imagine you’re at a casino, facing three coin-toss games. Each game reveals a different world of probability: the familiar normal distribution, the surprising log-normal distribution, and the mind-bending power law distribution. These games aren’t just about luck—they’re a crash course in how averages can mislead you, especially when extreme events dominate the outcomes.
| Game | Rules | Expected Value | Extreme Payout | Distribution Type |
|---|---|---|---|---|
| 1: Fixed Rewards | 100 tosses, $1 per head | $50 | $100 (all heads) | Normal |
| 2: Multiplicative Wins | 100 tosses, multiply by 1.1 (heads) or 0.9 (tails) | $1 | $14,000 (all heads) | Log-normal |
| 3: St. Petersburg Paradox | Payout doubles until first heads | ∞ | Uncapped | Power Law |
Game 1: Fixed Rewards and the Normal Distribution
At the first table, you get 100 coin tosses. Each head nets you $1. The expected value is easy: 100 tosses × 50% chance = $50. This game fits the classic normal distribution. If you played it hundreds of times, your results would cluster around $50, with only small swings above or below. This is the world of predictable averages—where extremes are rare, and the “average” is a reliable guide.
Game 2: Multiplicative Wins and the Log-Normal Distribution
Now, move to the second table. Here, you start with $1. For each toss, heads multiplies your winnings by 1.1, tails by 0.9. After 100 tosses, your payout is the product of all those multipliers. The expected value is still $1, but the median payout is only $0.61. Why? Because most outcomes shrink your winnings, but there’s a small chance of a huge windfall—up to $14,000 if you get all heads! This is the log-normal distribution: capped downside, but a heavy right tail. It’s a bridge between the predictable world of normals and the wild extremes of power laws. Here, “average” can be misleading, since rare, extreme events pull the mean far above what most players actually experience.
Game 3: The St. Petersburg Paradox and Power Law Distributions
The third table is where things get truly strange. This is the famous St. Petersburg Paradox. You toss a coin until you get heads. The payout doubles with each tails: $2, $4, $8, $16, and so on. The expected value of this game is infinite. As you play, the chance of a million-dollar payout is tiny—about 1 in a million—but it’s possible. In this power law distribution, the average never settles down. The more you play, the higher your theoretical average gets, because a handful of gigantic wins outweigh thousands of ordinary results. As the saying goes:
"The expected value of this game is infinite."
Heavy-Tailed Distributions: When Averages Lie
These three games show how heavy-tailed distributions—like log-normal and power law—break our intuition. In the normal world, averages are useful. But in the world of power laws, “average” is a mirage. Extreme events—rare, but massive—dominate the statistics. When you’re dealing with power law scenarios, you must rethink risk and reward, because the hidden extremes are where the real action lies.

Nature’s Power Laws: From Earthquakes to the Internet and Giant Apples
If you look closely at the world around you, you’ll notice a surprising pattern: many natural and social phenomena don’t follow the “normal” bell curve you might expect. Instead, they obey power law distributions, where a handful of extreme events dominate the landscape, and the rest are much smaller. This is true for earthquake magnitudes, data breaches, word usage, city sizes, and countless other systems. Let’s explore how these scaling laws shape the world—and why the average can be so misleading.
Earthquakes: When Two Exponentials Collide
Take earthquakes, for example. Small tremors happen all the time, but as the magnitude increases, earthquakes become exponentially rarer. At the same time, the energy released by each quake grows exponentially with its magnitude. When you combine these two opposing exponentials—one making big quakes rare, the other making them massively powerful—you get a power law. This means that while most earthquakes are tiny, the rare giants release almost all the energy. The catastrophe principle is at work: one big event, not the sum of many small ones, dominates the total impact.
| Event Type | Extreme Example | Odds or Impact |
|---|---|---|
| Earthquake Payout | $1,000,000 | Odds ≈ 1 in 1,000,000 |
| Data Breach | Millions affected from one hack | Ripple effects across networks |
| Tech Market Share | Top 5 companies | Control outsized share |
Scaling Laws in Nature and Society
This pattern isn’t limited to earthquakes. You’ll find similar power law examples in the branching of rivers, the veins in a leaf, the blood vessels in your lungs, and even the jagged path of lightning. These structures are self-similar at different scales—a property known as fractal geometry. The same mathematics that describes these natural wonders also governs the size of cities, the frequency of words in language, and the distribution of wealth.
- City sizes: A few cities (like Tokyo or New York) are gigantic, while most are much smaller.
- Word usage: A handful of words (“the,” “and,” “of”) dominate language, while most words are rare.
- Wealth: “If you’re standing in a room with Bill Gates or Elon Musk, the average wealth in that room is going to be 100 billion dollars or something. Because the average is dominated by one outlier.”
Extreme Events and the Catastrophe Principle
In systems ruled by power laws, the catastrophe principle reigns: totals are determined by rare, massive events—not by the sum of many typical ones. In the digital world, this means a single data breach can expose millions, while most breaches are minor. As one expert put it:
"A handful of companies, servers, and data centers hold the personal information of millions of people. So when one of them gets hacked, it can have ripple effects across the whole network."
You may never encounter an “average” day at all—extremes rule. Whether it’s a city’s population, a viral internet post, or a giant apple in an orchard, power laws reveal that the world is shaped by the wild, not the typical.
Into the Fractal Wild: Self-Organization and Criticality in Complex Systems
When you look closely at the world around you, you’ll notice that some of the most fascinating systems—like river networks, blood vessels, or even the magnetic domains inside a simple fridge magnet—don’t follow the rules of neat averages or tidy bell curves. Instead, they reveal a hidden order based on self-organization, criticality, and the mysterious logic of power law distributions. These systems are ruled by fractal geometry and scaling laws, where patterns repeat at every scale, and small changes can trigger massive effects.
Power Laws: The Signature of Scale-Free Systems
Power laws are more than just mathematical curiosities—they’re fingerprints of systems with no intrinsic scale. If you plot the size of events or structures in these systems, you’ll see that small occurrences are common, while huge, rare events still happen more often than you’d expect from a normal distribution. This is what makes power law distributions so revealing: they show you that the system is organized in a way where extremes matter just as much as the average.
Critical Points: Where Order and Chaos Collide
To see this in action, imagine holding a magnet and a screw. When the screw is cold, it’s attracted to the magnet because the atoms inside are lined up, forming regions called domains where their tiny magnetic moments point the same way. But if you heat the screw, you’ll notice a dramatic change—the magnetism vanishes. What’s happening inside?
At low temperatures, the atoms’ moments are stable and aligned, creating large, ordered domains. As you heat things up, the atoms start to vibrate and flip, breaking down this order. Right at a specific temperature—the Curie temperature—the system hovers at a critical point. Here, the domains are neither fully aligned nor completely random. Instead, you see a wild, ever-shifting patchwork of domains of all sizes, from tens to millions of atoms. There’s no single scale—just like a fractal.
Fractal Geometry and Scaling Laws at Criticality
Zoom in on these domains, and you’ll find the same kinds of patterns repeating at every level. This is the essence of fractal geometry: self-similar structures that look alike whether you’re viewing them up close or from far away. If you plot the domain size distribution at the Curie temperature, you get a power law. As one researcher put it:
"If you plot the size distribution of the domains, you get a power law."
This scale-free, fractal organization isn’t limited to magnets. You’ll find it in the branching of rivers, the veins in a leaf, the structure of lightning, and even in the firing patterns of neural populations. Nature seems to favor these patterns at the edge of phase transitions, where systems are balanced between order and chaos.
Self-Organization: Nature’s Path to Criticality
What’s remarkable is that many complex systems naturally self-organize to these critical points. They tune themselves to the brink, where power law behaviors dominate. This is why you see sandpile avalanches, stock market crashes, and bursts of brain activity all following similar scaling laws. At criticality, local interactions—like one atom flipping or one grain of sand falling—can ripple out and cause system-wide changes. Influence spreads from the tiniest parts to the whole, explaining why ordinary events can sometimes explode into blockbusters.
- Power laws reveal systems with no intrinsic scale—fractal geometry abounds.
- At critical points, power law patterns emerge as systems teeter on the edge of phase transitions.
- Self-organization drives systems to criticality, where scaling laws and domain size distributions follow power laws.
- Criticality links local rules to global behavior—tiny causes can have massive results.
Wild Cards and Tangents: Why We Don’t See the World as It Really Is
Most of us see the world through the lens of averages. We expect things to cluster around a “normal” value, like height or test scores. This intuition works fine for bell-curve, or normal, distributions. But in many real-world systems—like wealth, natural disasters, or viral trends—the rules are different. These are heavy-tailed distributions, where extreme events are not just possible, but expected. If you rely on averages in these cases, you’re wearing the wrong glasses and missing the real risks.
Our Intuition vs. Heavy-Tailed Reality
Think about how you judge risk. Maybe you look at the average flood damage in your area or the average return on an investment. But in a world governed by power laws, the average can be a trap. In heavy-tailed distributions, the probability of a massive event—a “wild card”—is much higher than your gut tells you. That’s why insurance, investment, disaster planning, and cybersecurity often misjudge the true scale of risk. They plan for the average, not the outlier.
“Because the average is dominated by one outlier.”
Imagine you’re in a room with Elon Musk. Suddenly, the average wealth in the room skyrockets. As the saying goes: “If you’re standing in a room with Elon Musk, the ‘average’ wealth suddenly isn’t about you at all.” This is the heart of the catastrophe principle—one extreme event can outweigh everything else.
The Comfort Blanket of Averages
It feels safe to trust the average. But in heavy-tailed systems, the average keeps rising the more you measure, because you’re likely to eventually hit a giant outlier. It’s like rolling dice, but every so often, you get a number a thousand times higher than anything you’ve seen before. The “average” is a comfort blanket, not reality.
- Metaphor: You’re more likely to lose your house in a single massive flood than in a dozen small storms.
- Risk Management: Focusing on the average can blind you to catastrophic losses or gains.
The 80/20 Rule and the Pareto Principle
Many systems follow the 80/20 rule (also known as the Pareto principle): 80% of effects come from 20% of causes. This isn’t just about wealth. What if language, traffic jams, or viral memes follow the same rule as earthquakes and billionaires? In these systems, a few “wild cards” drive most of the action.
Why Experts Get Fooled
Even domain experts can miss the mark. Their experience is often shaped by “normal” events, so they expect smooth curves when reality serves up cliffs. That’s why the pandemic, viral videos, or sudden market crashes seem so shocking. But in a power law world, these weird outcomes are not just possible—they’re predictable.
How to See the World More Clearly
- Recognize when you’re dealing with a heavy-tailed distribution.
- Plan for the wild outliers, not just the average.
- Understand that in some systems, the rarest events matter most.
A surprising number of chaotic-seeming phenomena are predictable—if you swap your bell-curve glasses for power-law shades. Understanding power law distributions protects you against naive optimism or wild underestimation of risk. In a world of wild cards and tangents, the average can lie to you.
FAQ: Burning Questions About Power Laws, Outliers, and Real-Life Risk
What is a power law distribution in plain English?
A power law distribution is a way some things in the world are spread out: a small number of cases are extremely large, while most are much smaller. Unlike a bell curve (normal distribution), where most values cluster around the average, power laws have heavy tails. This means rare, huge events are much more likely than you’d expect. For example, in wealth, a few people have fortunes many times bigger than the rest, following the Pareto Principle or 80/20 rule: 20% of people often hold 80% of the wealth.
How can a single outlier skew all the data?
In heavy-tailed distributions, a single outlier—like a billionaire in income data or a mega-earthquake—can dominate the average. For instance, if you measured the average wealth in a room and Bill Gates walked in, the average would shoot up, even though nothing changed for everyone else. In power law worlds, the average is often unreliable because it’s so sensitive to these extreme events.
Where do we see power laws pop up in daily life?
- Wealth and income (a few people have most of the money)
- Internet traffic (a few sites get most of the clicks)
- Natural disasters (most earthquakes are tiny, but a few are massive)
- Book and movie sales (a handful become blockbusters)
- Social media (a few posts or videos go viral, most get little attention)
These are all examples where the power law distribution shapes outcomes, and outliers matter more than the average.
Do power law distributions mean averages are always unreliable?
Not always, but often. In normal distributions (like height or IQ), the average is meaningful because extreme values are rare and bounded. In heavy-tailed distributions, the average can be misleading or even undefined because a single outlier can outweigh thousands of typical cases. In these situations, it’s better to look at medians or percentiles, or to focus on the risk of extreme events.
How can I spot when a power law might apply instead of a bell curve?
- Look for extreme outliers that are much larger than the rest
- Check if the data spans several orders of magnitude (e.g., from $10 to $10,000,000)
- Plot the data on a log-log plot: if it forms a straight line, you likely have a power law
- Notice if the average keeps rising as you add more data—another power law hint
What does this mean for big decisions in finance, science, or crisis planning?
In fields governed by power laws, like investing, disaster planning, or technology, risk management must focus on rare, extreme events. Past averages can’t predict the future well. Instead, you need to prepare for the possibility of “black swan” events—those rare but devastating outliers. This is why insurance companies, venture capitalists, and emergency planners use models that account for heavy-tailed risk.
Is it possible to protect against the dangers of extreme events?
You can’t eliminate risk, but you can manage it. Strategies include:
- Diversifying investments or resources
- Using insurance for catastrophic losses
- Building robust systems (like using VPNs to guard against data breaches)
- Allowing small failures (like controlled burns in forests) to prevent massive disasters
Understanding power law distributions helps you prepare for the unpredictable, rather than being blindsided by it.
Conclusion: Curiosity in a Power Law World—Why We Should (and Shouldn’t) Trust the Average
As you reach the end of this journey through the world of power law distribution and heavy-tailed distributions, one lesson stands out: averages can be dangerously misleading in the face of extreme events. In systems governed by normal distributions, like human height or apple sizes, the average is a reliable guide. Outliers are rare and have little impact on the whole. But in a power law world, outliers are not just the exception—they are the story. The rare, the unpredictable, and the extreme events shape the system far more than the average ever could.
Consider the examples you’ve seen: the distribution of wealth, the reach of internet content, the devastation of earthquakes and wildfires, or the outcomes of venture capital investments. In each case, the average hides the true drivers of impact. A handful of runaway successes or catastrophic failures account for most of the results. As the saying goes, “outliers are the tale, not the tail, in a power law world.” If you rely on the average here, you risk missing the real nature of risk and reward.
This insight has real consequences for risk management and decision-making. When you plan for the future—whether you’re investing, building infrastructure, or preparing for disasters—don’t be lulled into a false sense of security by averages. Heavy-tailed distributions mean that rare, extreme events are not just possible; they are inevitable over time. The more you measure, the more the average itself can shift, pulled upward by the next big outlier. As you saw with insurance companies and forest fires, failing to account for the fat tails of power laws can lead to disaster.
So, should you trust the average? In some domains, yes—the average is your friend when the world is stable and predictable. But in power law domains, you need a different mindset. Be skeptical of small sample statistics. Prepare for the improbable. Recognize that the most important events may be the ones you haven’t seen yet. As one expert put it,
“Recognizing these patterns is critical if you want to make sense of the world’s biggest risks and rewards.”
Power laws are a call to curiosity and humility. They remind you that the world’s uncertainties are often bigger and wilder than you imagine. Rather than seeking safety in numbers, you might need to learn to dance with the wildness of outliers. This means being bold—making repeated, intelligent bets in fields where one success can change everything, and not being discouraged by a string of failures. It also means being prepared—building resilience against rare disasters, not just the routine.
In the end, embracing the logic of power law distributions is about more than statistics. It’s about seeing the world as it truly is: unpredictable, uneven, and full of hidden extremes. If you want to thrive in a power law world, stay curious, stay skeptical, and always keep an eye out for the extraordinary hiding in the improbable. The future belongs to those who can spot the clues in the chaos—and who aren’t afraid to take a chance on the next big outlier.
TL;DR: Power law distributions show that a small number of outliers can disproportionately impact everything from wealth to earthquakes. Recognizing these patterns is critical if you want to make sense of the world’s biggest risks and rewards.
Post a Comment